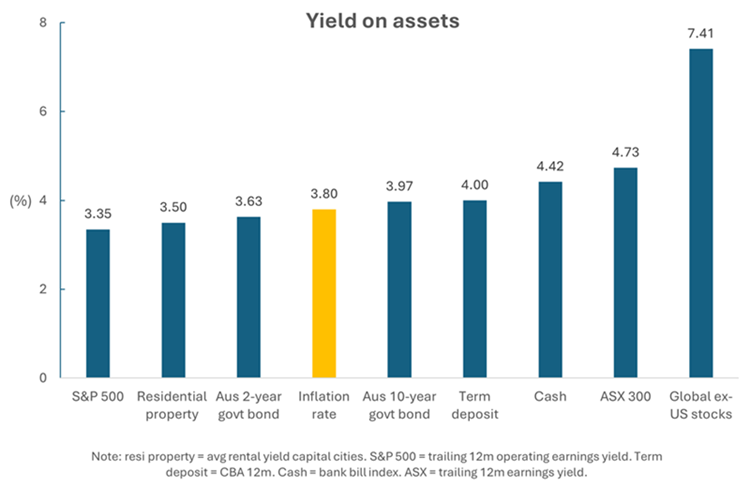
Periodically, I give an update on the valuations of key asset classes and how they compare. Here’s the latest chart on yields for the four major asset classes: cash, bonds, property, and stocks. I’ve included the inflation rate as a point of comparison.
 Sources: Firstlinks, CoreLogic, Robert Shiller, CBA, ASX, Morningstar
What stands out is that the yields on many asset classes are quite condensed. When I’d compiled this chart 10 months ago, inflation was much higher and there was a greater dispersion in yields. Most assets have performed well of late and that’s lowered the yields for them.
It seems to me that most of the assets are pricing in inflation coming down further. The reason is that when you buy an asset, you’re hoping to earn a yield above the inflation rate ie. a positive real return. Yet some asset classes are currently yielding below the inflation rate, and others are only marginally above. Note that in the above chart, I've used the quarterly inflation figure, which is widely considered more reliable than the monthly number.
The odds favour inflation declining further, though whether it goes lower and stays lower is the question. Australia has stickier inflation than many other developed countries after not raising rates as aggressively.
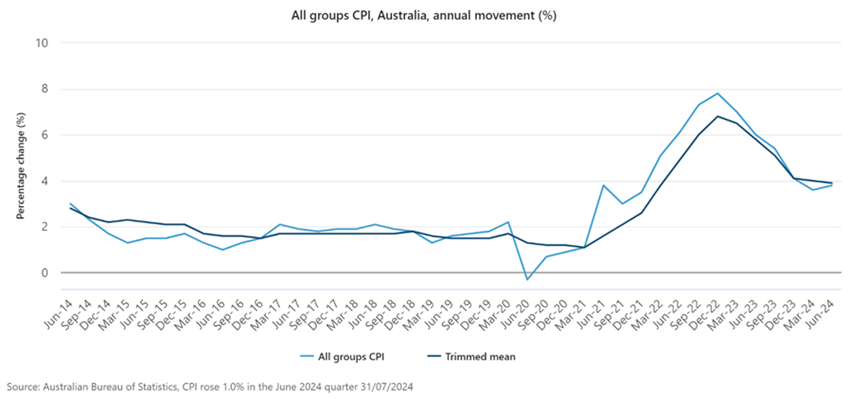
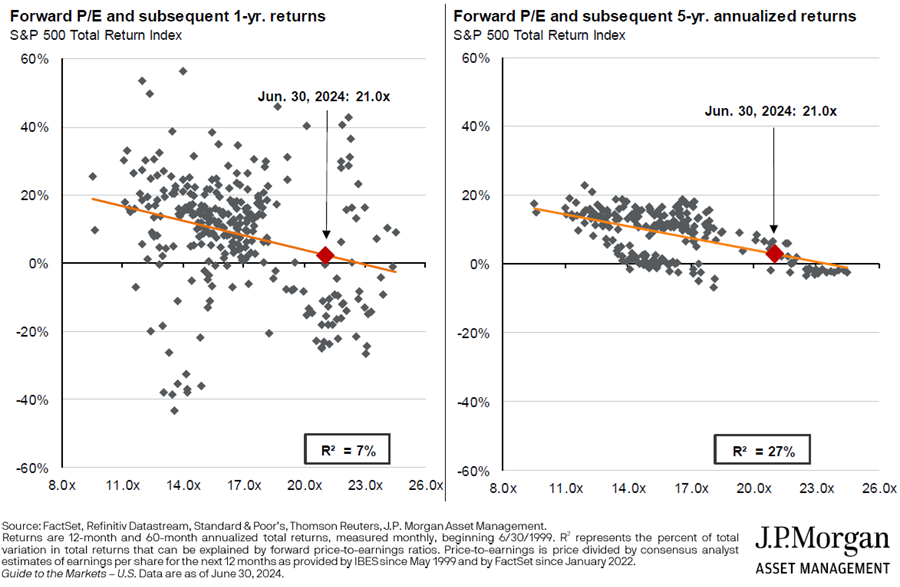
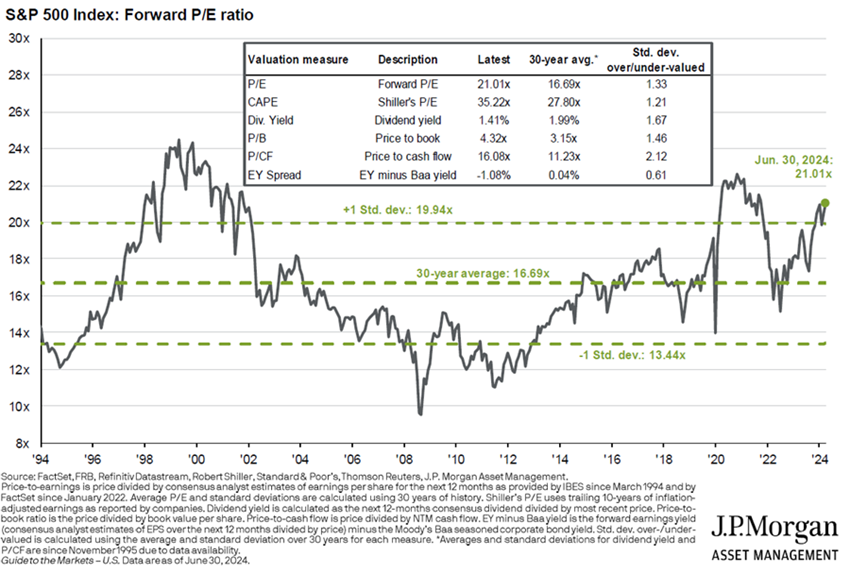 At a 21x forward price-to-earnings ratio (PER), the S&P 500 is well above its average PER of 16.7x. Through history, the higher the PER, the lower future returns have been.
 The technology, consumer discretionary, and healthcare sectors in the US look most overvalued. For instance, US tech is trading at 30x forward P/E versus its 18x average of the past 20 years.
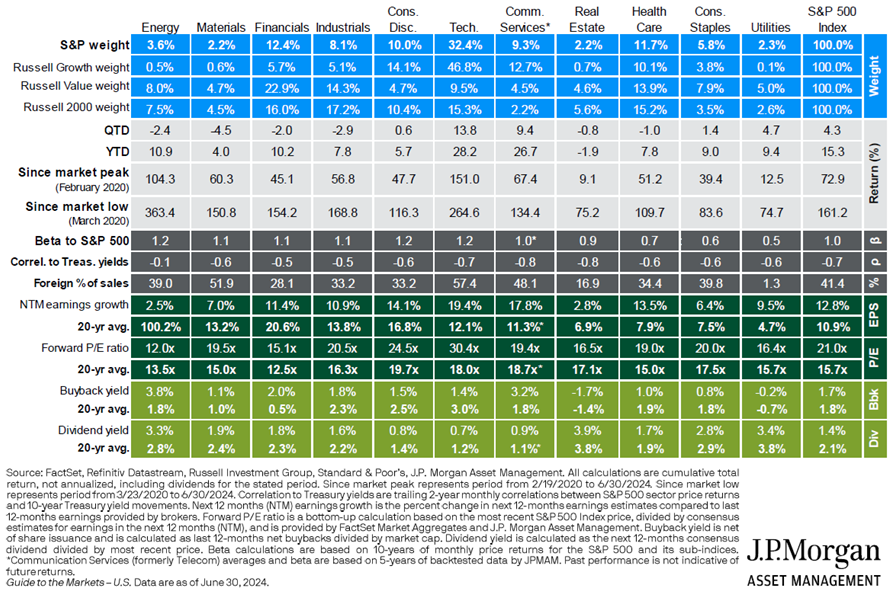 Much of the overvaluation resides among the largest companies in the US. Many are pricing in gains from AI and the consensus outlook for an economic soft landing in America. If either of these falters, earnings may disappoint, and valuations will come under pressure.
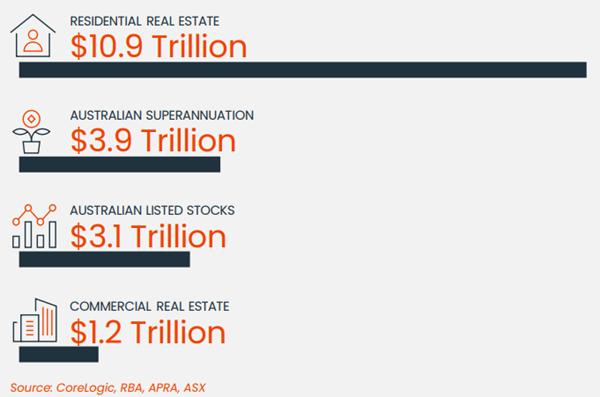 I’ve stated previously that residential property in Australia is possibly the most expensive asset anywhere in the world. And that it’s at least 40% overvalued, in my view. I stand by that view, and here’s why.
The gross rental yield on property is 3.5% in capital cities. That gross yield is essentially revenue for a landlord. Therefore, the yield essentially equates to a price to sales (P/S) ratio of 29x (ie. 100 divided by the gross yield).
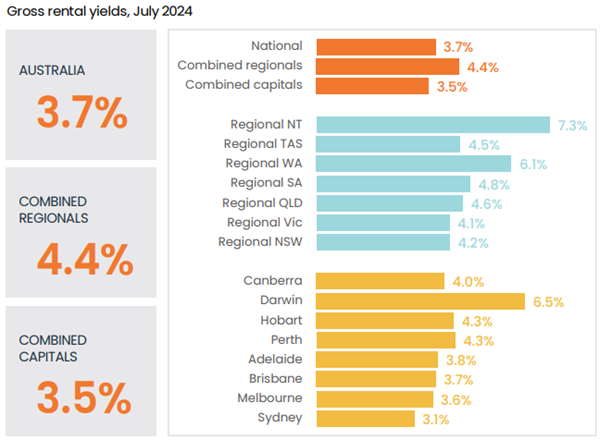 Source: CoreLogic
That P/S ratio is extraordinarily expensive. For instance, Nvidia – the world’s third largest company by market capitalization and regarded by most observers as expensive if not bubble-like – currently trades at a P/S ratio of 28x.
That’s not the fully story though. The gross yield on property comes before costs, including maintenance, interest, and taxes. Property experts I speak to suggest maintenance and other operating expenses would reduce that yield by at least 1%. In other words, the yield would be sub-2.5%, and that’s before taxes.
Let’s be generous and call it a 2.5% net yield for residential property. That equates to a price-to-earnings ratio of 40x. Again, compared to the pricey US tech sector, that P/E ratio also looks high. And remember, US tech company earnings are growing exponentially, while those of property aren’t.
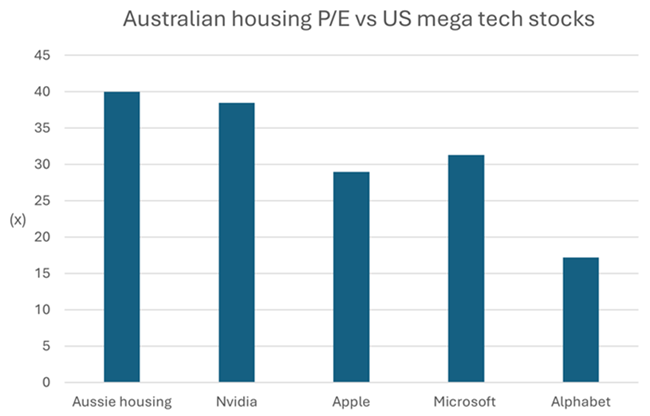 Note: tech stocks = forward P/E. Source: CoreLogic, Morningstar
Compared to other housing markets around the world, Australia also stands out. The price to income ratio is 9.7x, about double that of the US. The ratio has more than trebled over the past 40 years.
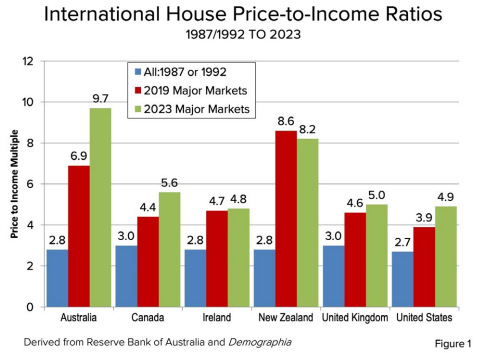 Australia has three cities in the top 10 least affordable metropolitan markets in the world, according to consultants, Demographia. Incredibly, the likes of Adelaide rank as less affordable than global destinations such as New York.
For price to income ratios to decline, either prices must drop or incomes need to rise. The outlook for incomes looks relatively muted. Meanwhile, supply constraints mean prices are unlikely to come down in the near term, though growth from here may prove more challenging.
In other words, Australian residential real estate may be one of the globe’s most expensive assets, but it’s likely to remain that way, at least in the short term.
 Source: A Wealth of Commonsense
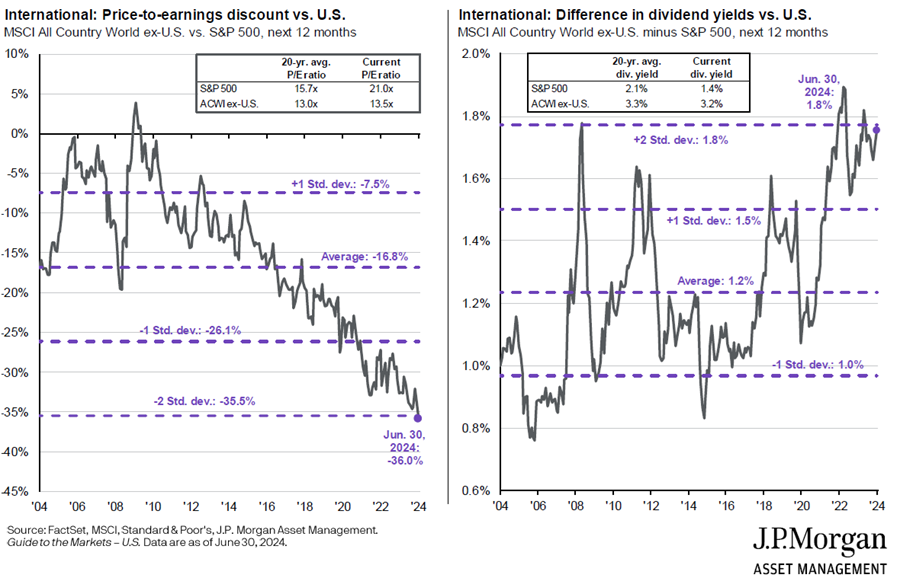
That’s led to favourable valuations for global stocks, especially compared to the US. The dividend yield on international shares of 3.2% is also much higher than the 1.4% of the US.
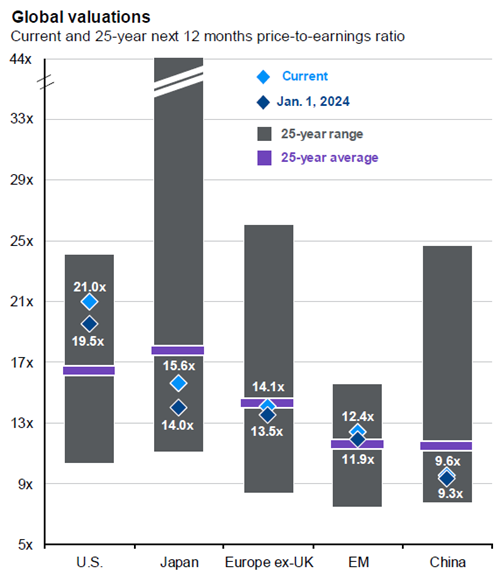
 Of the different markets, Japan and Emerging Markets offer good value. China is cheap and due for a bounce back, though whether that proves sustainable will depend on fixing a broken political and economic model.
 Source: JP Morgan
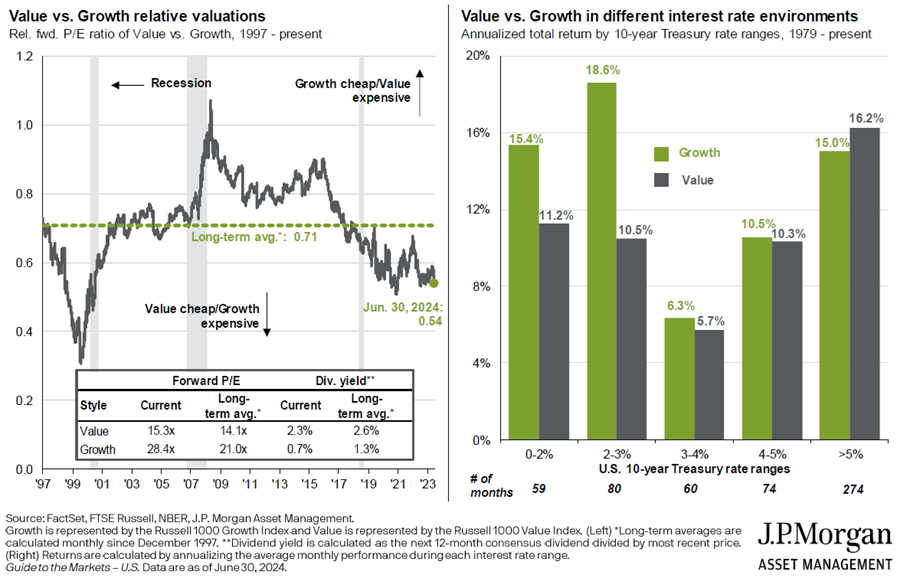 Interestingly, the chart on the right shows that value stocks perform especially well in higher interest rate environments. So, if you’re worried about high inflation and rates, owning value stocks makes sense.
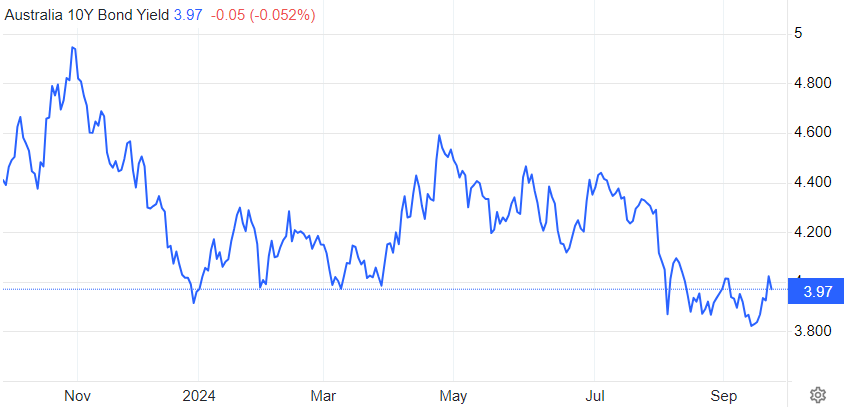 Source: Trading Economics
At this time last year, many investors were declaring that the 60/40 portfolio (60% equities, 40% bonds) was dead. That’s proven overblown.
However, given the recent pickup in bond prices, the yields on bonds are less attractive now. With 2-year Australian bond yields at 3.63% and 10-year yields at 3.97%, they don’t offer the same value as they did 12-18 months ago. And the key risk for bonds is that inflation stays sticky in Australia.
How do bonds compare to cash? The two assets serve different purposes in a portfolio. Cash is more of a placeholder, until there’s a better place to allocate money. Bonds serve as a ballast in a portfolio, buffering it against the potential for sharp drawdowns in riskier assets. Bonds also gives investors protection against economic downturns, which is something that cash doesn’t do.
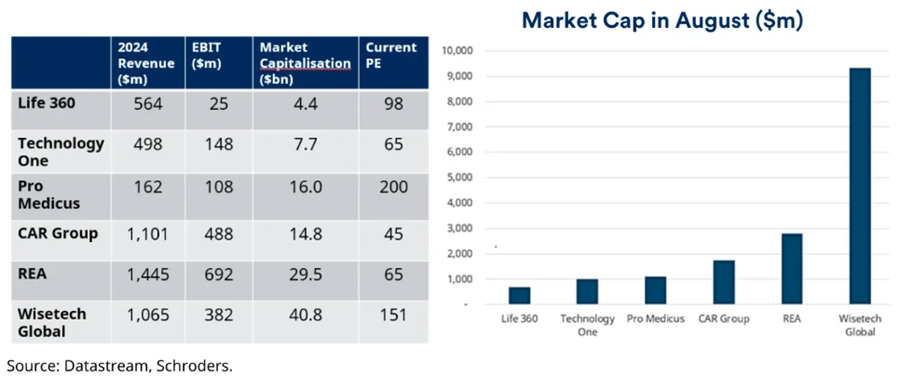 Banks have also been bid up. Possible reasons for this include ever-increasing superannuation and ETF flows into the sector and cash exiting the depressed mining sector and into banks.
It’s left financials sector valuations on par with the ASX 200. That’s unusual as banks traditionally trade at a discount to the index due to them being cyclical and selling highly commoditized products.
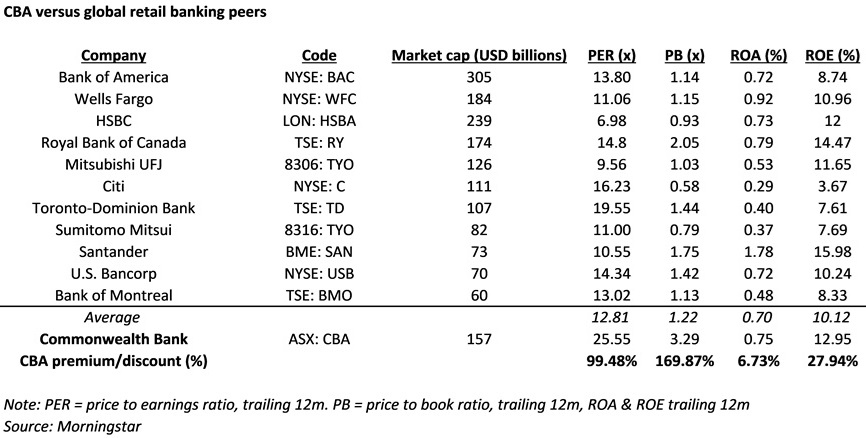
Note that the bank’s steep valuations can be primarily attributed to the otherworldly pricing attached to Commonwealth Bank (ASX: CBA). CBA is the most expensive retail bank in the developed world, and it’s not even close.
 Meantime, the mining and energy sectors have been left behind. Yes, China is depressing demand in many commodities, with iron ore at the top of the least. However, supply remains constrained in several commodities, including copper, oil, and coal, and that augurs well for prices going forward.
While of these sectors, there are pockets of opportunity. Earlier this year, I wrote an article on 16 ASX stocks to buy and hold forever. It was a wish list – stocks to buy in future at the right price.
Of the stocks, there are four that currently offer value, albeit for different reasons:
 Sources: Firstlinks, CoreLogic, Robert Shiller, CBA, ASX, Morningstar
What stands out is that the yields on many asset classes are quite condensed. When I’d compiled this chart 10 months ago, inflation was much higher and there was a greater dispersion in yields. Most assets have performed well of late and that’s lowered the yields for them.
It seems to me that most of the assets are pricing in inflation coming down further. The reason is that when you buy an asset, you’re hoping to earn a yield above the inflation rate ie. a positive real return. Yet some asset classes are currently yielding below the inflation rate, and others are only marginally above. Note that in the above chart, I've used the quarterly inflation figure, which is widely considered more reliable than the monthly number.
The odds favour inflation declining further, though whether it goes lower and stays lower is the question. Australia has stickier inflation than many other developed countries after not raising rates as aggressively.

The overvalued: US stocks
Let’s first run through what I consider the overvalued asset classes. The S&P 500 looks expensive, and parts of it appear very expensive. On most valuation metrics, it’s 1-2 standard deviations overvalued compared to history. At a 21x forward price-to-earnings ratio (PER), the S&P 500 is well above its average PER of 16.7x. Through history, the higher the PER, the lower future returns have been.
 The technology, consumer discretionary, and healthcare sectors in the US look most overvalued. For instance, US tech is trading at 30x forward P/E versus its 18x average of the past 20 years.
 Much of the overvaluation resides among the largest companies in the US. Many are pricing in gains from AI and the consensus outlook for an economic soft landing in America. If either of these falters, earnings may disappoint, and valuations will come under pressure.
The overvalued: Australian housing
Residential real estate dwarfs every other asset in size in Australia. At almost $11 trillion dollars, it’s 3.5x larger than the market for publicly listed stocks, 2.8x bigger than the superannuation sector, and 2.5x total GDP. I’ve stated previously that residential property in Australia is possibly the most expensive asset anywhere in the world. And that it’s at least 40% overvalued, in my view. I stand by that view, and here’s why.
The gross rental yield on property is 3.5% in capital cities. That gross yield is essentially revenue for a landlord. Therefore, the yield essentially equates to a price to sales (P/S) ratio of 29x (ie. 100 divided by the gross yield).
 Source: CoreLogic
That P/S ratio is extraordinarily expensive. For instance, Nvidia – the world’s third largest company by market capitalization and regarded by most observers as expensive if not bubble-like – currently trades at a P/S ratio of 28x.
That’s not the fully story though. The gross yield on property comes before costs, including maintenance, interest, and taxes. Property experts I speak to suggest maintenance and other operating expenses would reduce that yield by at least 1%. In other words, the yield would be sub-2.5%, and that’s before taxes.
Let’s be generous and call it a 2.5% net yield for residential property. That equates to a price-to-earnings ratio of 40x. Again, compared to the pricey US tech sector, that P/E ratio also looks high. And remember, US tech company earnings are growing exponentially, while those of property aren’t.
 Note: tech stocks = forward P/E. Source: CoreLogic, Morningstar
Compared to other housing markets around the world, Australia also stands out. The price to income ratio is 9.7x, about double that of the US. The ratio has more than trebled over the past 40 years.
 Australia has three cities in the top 10 least affordable metropolitan markets in the world, according to consultants, Demographia. Incredibly, the likes of Adelaide rank as less affordable than global destinations such as New York.
For price to income ratios to decline, either prices must drop or incomes need to rise. The outlook for incomes looks relatively muted. Meanwhile, supply constraints mean prices are unlikely to come down in the near term, though growth from here may prove more challenging.
In other words, Australian residential real estate may be one of the globe’s most expensive assets, but it’s likely to remain that way, at least in the short term.
The undervalued: international stocks
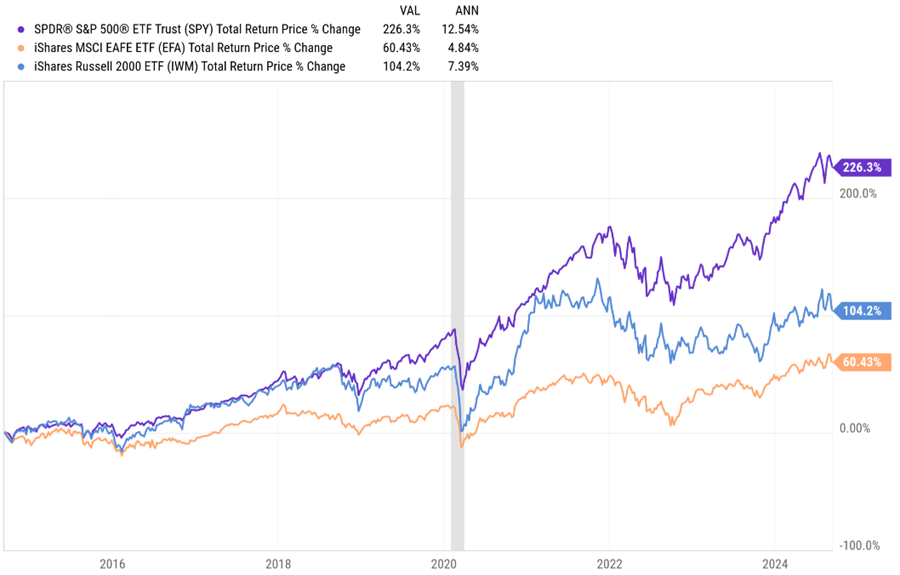
Outside of the US, stocks look reasonable value. International stocks have had mediocre returns over the past decade, badly lagging America’s. Source: A Wealth of Commonsense
That’s led to favourable valuations for global stocks, especially compared to the US. The dividend yield on international shares of 3.2% is also much higher than the 1.4% of the US.
 Of the different markets, Japan and Emerging Markets offer good value. China is cheap and due for a bounce back, though whether that proves sustainable will depend on fixing a broken political and economic model.
 Source: JP Morgan
The undervalued: value stocks
Value stocks may also be an opportunity. Over the past 15 years, growth stocks have left value stocks for dead. Because of this, there are few true value-oriented fund managers left. It’s resulted in value being inexpensive. Interestingly, the chart on the right shows that value stocks perform especially well in higher interest rate environments. So, if you’re worried about high inflation and rates, owning value stocks makes sense.
The undervalued: small caps
Small caps may also be a contrarian play. They’ve significantly underperformed large caps in Australia and globally over the past decade, leaving them on undemanding valuations. Smaller companies are generally carrying larger debt loads, which means that they’re more sensitive to changes in interest rates. If rates are heading down, small caps may be a primary beneficiary.The undervalued: cash
It seems odd to say that cash is undervalued, though I’d suggest it might be. Investors poured money into term deposits last year, after stocks and bonds endured a poor 2022. That defensive stance has slowly switched. This year, the cash in term deposits has eked out into risk assets as investors get more comfortable with the outlook for the likes of equities. The question is whether term deposits are still attractive in the current environment. With 12 month term deposits of up to 4.9% available at reputable banks, there still appears to be value here, especially with inflation at 3.8% and many risk assets offering inferior yields.The fairly valued: Australian bonds
Bonds have performed reasonably well over the past 12 months, though most retail investors still seem to be gun shy given the poor performance of this asset class over the prior three years. Source: Trading Economics
At this time last year, many investors were declaring that the 60/40 portfolio (60% equities, 40% bonds) was dead. That’s proven overblown.
However, given the recent pickup in bond prices, the yields on bonds are less attractive now. With 2-year Australian bond yields at 3.63% and 10-year yields at 3.97%, they don’t offer the same value as they did 12-18 months ago. And the key risk for bonds is that inflation stays sticky in Australia.
How do bonds compare to cash? The two assets serve different purposes in a portfolio. Cash is more of a placeholder, until there’s a better place to allocate money. Bonds serve as a ballast in a portfolio, buffering it against the potential for sharp drawdowns in riskier assets. Bonds also gives investors protection against economic downturns, which is something that cash doesn’t do.
The fair valued: Australian stocks
The other asset that seems fair valued is Australian stocks. It’s deceptive, however, as the market is split between the haves and have nots. On the one hand, the prices for tech companies are extraordinary. Banks have also been bid up. Possible reasons for this include ever-increasing superannuation and ETF flows into the sector and cash exiting the depressed mining sector and into banks.
It’s left financials sector valuations on par with the ASX 200. That’s unusual as banks traditionally trade at a discount to the index due to them being cyclical and selling highly commoditized products.
Note that the bank’s steep valuations can be primarily attributed to the otherworldly pricing attached to Commonwealth Bank (ASX: CBA). CBA is the most expensive retail bank in the developed world, and it’s not even close.
 Meantime, the mining and energy sectors have been left behind. Yes, China is depressing demand in many commodities, with iron ore at the top of the least. However, supply remains constrained in several commodities, including copper, oil, and coal, and that augurs well for prices going forward.
While of these sectors, there are pockets of opportunity. Earlier this year, I wrote an article on 16 ASX stocks to buy and hold forever. It was a wish list – stocks to buy in future at the right price.
Of the stocks, there are four that currently offer value, albeit for different reasons:
- ASX Ltd (ASX: ASX) – problems now with replacing Chess but still a superb business with multiple ways to win.
- SkyCity (ASX: SKC) – casinos are hated, but therein lays the opportunity with this sound operator.
- The Lottery Corporation (ASX: TLC) – brilliant business, and valuations are starting to look ok.
- Washington H Soul Pattinson (ASX: SOL) – Its main businesses in New Hope, Brickworks and TPG should bounce back from cyclical issues.


